Data, Design and Society
Ewan Klein & Alyssa Alcorn
2 March 2016
Just Writing
Today’s Prompts
- The priorities this week for my DDS team are …
- The things that I really want to do this week are …
Feedback on Reports
What I Learned
I need to be more explicit about what should be in the report!
Context
- It’s very helpful to set your theme in a wider context.
- Relate it to the Essential Reading section of the reading list.
- Although this is not a course where you are expected to do a lot of reading, do refer to a few other references from the More Depth section to provide more background or motivation to your project.
Data vs. Interpretation
What data did you collect for the Fast Hack? What methods did you use to collect it, and how are you dealing with data management?
- Try to put all the relevant information about the data collection in the Data section. E.g.:
- How many respondents were there for each data collection?
- What categories of people provided data?
- Where did you collect the data?
- What questions were on your survey? (If too many, list these in an appendix.)
Data isn’t Neutral
- You will use categories in your data collection; e.g. china cups vs. paper cups.
- What are the assumptions behind your categorisation? Can you justify them?
Tables, Charts, Photos
- In general, having tables and graphics will make your reports more interesting and thought-provoking.
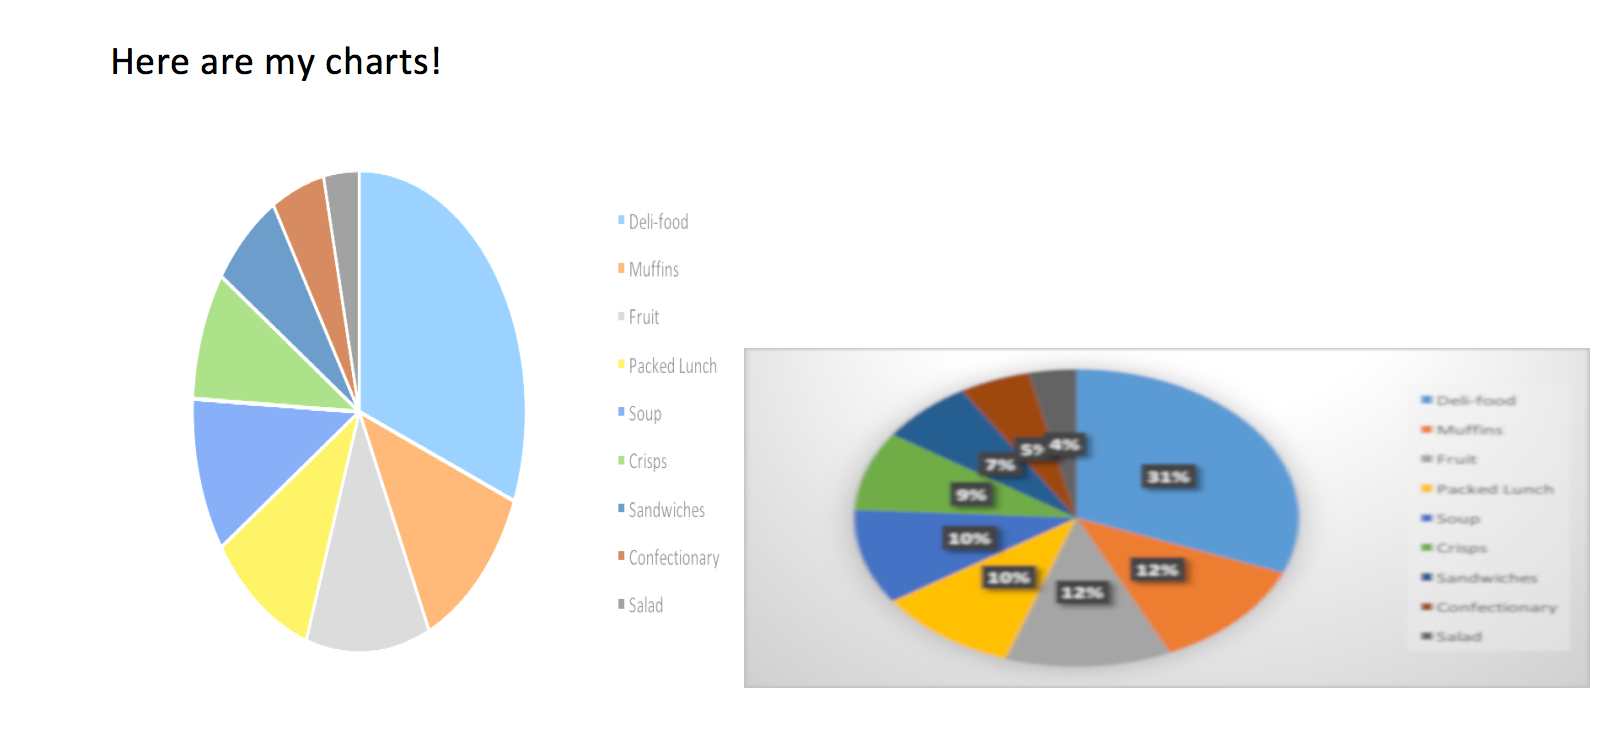
- But not if the image quality is terrible. Prepare well in advance.
Communicating Data
Ann never goes to Baristo, but goes to Starbucks 5 times a week. By contrast Bob never goes to Starbucks, but goes to Baristo twice a week. He also goes to Brew Lab 6 times a week, where Ann never goes. He goes to Dome Cafe once a week, while Ann goes there 3 times a week.
| Ann | Bob | |
|---|---|---|
| Baristo | 0 | 2 |
| Dome Cafe | 3 | 1 |
| Brew Lab | 0 | 6 |
| Starbucks | 5 | 0 |
Tufte
Graphical excellence consists of complex ideas communicated with clarity, precision and efficiency
Graphical excellence gives the viewer:
- the greatest number of ideas
- in the shortest time
- with the least ink
- in the smallest space

